Coinbase Advanced gives you more robust tools to make better trading decisions. You have access to real-time market information through interactive charts, order books, and live trade history on the advanced trade view. Coinbase Advanced now offers TradingView functionality with custom drawing tools, 104 indicators, and new chart types.

Depth chart: The depth chart is a visual representation of the order book, showing bid and ask orders over a range of prices, along with the cumulative size.
Order book: The order book panel shows the current open orders on Coinbase in a ladder format.
Order panel: The order (buy/sell) panel is where you place orders on the order book.
Open orders: The open orders panel displays maker orders that have been posted, but not filled, canceled, or expired. To view all of your order history, select the order history button and view all.
Price chart
The price chart is a fast and easy way to view historical pricing. You can customize your price chart display by time range and chart type, as well as use a series of indicators to provide additional insight into pricing trends.
Time range
You can see the pricing history and trading volume of an asset over a specific span of time.
The candles on the y-axis (vertical line) reflect the high and low price of an asset for a specific time interval, which can be changed by selecting from the dropdown in the upper left-hand corner of the price chart |
|
|---|---|
The x-axis (the horizontal line) allows you to see the trading volume over a specific date range, which can be changed in the bottom left-hand corner of the chart |
|
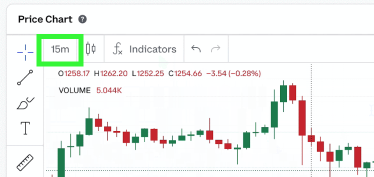

Chart types
The candlestick chart displays the high, low, open, and closing prices of an asset for a specific time frame.
O (open) is the opening price of the asset at the beginning of the specified period.
H (high) is the highest trading price of the asset in that period.
L (low) is the lowest trading price of the asset in that period.
C (close) is the closing price of the asset at the end of the specific period.
Check out this guide on how to read candlestick charts for more information.
The line chart captures an asset's historical price by connecting a series of data points with a continuous line.
Indicators
Coinbase has partnered with TradingView to bring you 104 market indicators. These indicators track market trends and patterns to help inform your trading decisions. You can select multiple indicators to give you a better perspective of an asset’s buy and sell price.

Here are some of the most commonly used indicators:
RSI (relative strength index) shows a trend’s duration and helps you spot when it will reverse.
EMA (exponential moving average) captures how quickly a trend is moving and its strength. EMA measures the average price points of an asset.
SMA (smooth moving average) is like an EMA but measures the average price points of an asset over a longer period of time.
MACD (moving average convergence/divergence) measures the relationship between the highest and lowest average price points. When a trend is forming, the graph will converge or meet at a specific value.
Sticky settings for easy charting and order entry
To reduce the number of clicks per trade, the system will persist your recent selections in the order form such as side (buy or sell), order type, and advanced settings like time in force and execution type. Note that order form settings will not persist across browsers or devices.
Changes you make to the informational components on the trade page will also be saved across sessions. These include:
layout changes, like selecting the depth chart or price chart as the primary tab
order book precision (saved for each market)
price chart settings like interval, chart type, indicators and drawings (saved for each market)
Disclosures
Coinbase offers simple and advanced trading platforms on Coinbase.com. Coinbase Advanced is intended for a more experienced trader and enables traders to interact directly with the order book. Fees vary based on the trading platform. Content in our trading and educational materials are for informational purposes and is not investment advice. Investing in cryptocurrency comes with risk.